Business owners use the intelligent financial dashboard software to plan business objectives.
Why do you need a financial dashboard software? The software helps you generate financial reports. And help you understand the numbers from key data illustrated in graphs. Monitor business operations, costs, and revenues with their help. Business activities show in the financial performance. Learn how they show in your business. For example, use the financial dashboard software to display, track, and report your business KPIs. Gross profit margin, operating profit margin, and operating expenses will show there. Set them up and you can track your cash flow, profits, expenses, and sales.
What Is a KPI Dashboard?
It displays key performance indicators for your analysis and review of business data. It’s an overview of the liquidity in your business. Data display in graphs and charts measuring key objectives over time.
For different aspects of your business get a free learning template and download it. View, learn, and understand the sales tracking template.
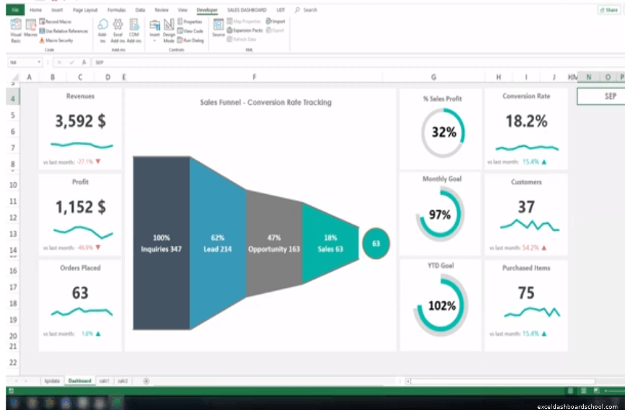
The sales dashboard features the most important financial indicators in sales. Your focus is on the visualization and not on data entry. The spreadsheet contains a KPI data sheet, calculation sheets and a dashboard. The metrics in the ‘Dashboard’ layer are at the left side. It contains revenues, profits and placed orders.
The key element of the dashboard is the sales funnel. It is the path the website visitors follow before engaging in purchasing. When you understand why the sales funnel has that shape, you can find out how to adjust it. Choose the numbers to fit your sales targets. Increase the placed orders in the KPI data sheet. It reflects in the dashboard sheet. Modify the data numbers until you have the desired results for revenues and profits.
On the right side of the sales funnel you see more metrics. It refers to the percentage of sales profits, the percentage to your goals, monthly and yearly. If you want to see it by month, select the specific month further to your right. Then, you create specific reports for sales or other business areas. Understanding them help you improve your business.
How Can You Get a Free Dashboard?
There are some reliable and free dashboards to assist you handling the business KPIs.
Databox has a free financial dashboard software. It’s perfect for customization, analysis, and reporting business data in a single source.

